CFA Python Course:Data Wrangling
Using NumPy and pandas

Using NumPy and pandas

This project was a bit unique given that I was not creating a tool and a game, but rather I was using python's libraries, specifically NumPy and pandas to dissect various sets of financial data. These exercises and datasets were provided to me by an individual who taught a CFA python training course sponsored by the University of Minnesota. There are a total of 7 exercises increasing in difficulty whose purpose is utilize NumPy and pandas to extract valuable insights from the data with ease.

The first exercise is to get the volume weighted average closing price of SPY which is an S&P 500 ETF. The procedure of calculating this is straight forward. One must take each trading day’s volume divided by the total volume of the month then multiplied by the closing price of the day. The summation of this calculation for each day will then result in the volume weighted average price for the month. Below is the formula written out to solve the problem.
∑𝑖 (𝑣i/𝑣m)* ci
𝑖 ranges over the days of the month
𝑣𝑖 is the volume on day 𝑖
𝑣𝑚 is the total volume over the month
𝑐𝑖 is the close price for day 𝑖
Another exercise that was interesting calculating a stock’s PNL. A stock’s PNL is simply calculated by taking its current day price and subtracting the previous day’s price. The dataset had an “adjusted” price for each trading day which was the average daily trading price. To calculate the daily PNL of the stock, a for loop needs to be used to iterate through each day and taking the current price and subtracting the previous day’s price. Some if statements can also be used to track whether the stock ticker symbol has changed as there were a total of 4 different stocks in the dataset.
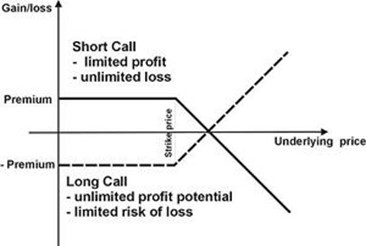
A more complex calculation that pandas can help with is calculating the PNL of an option. In this case, we are analyzing the PNL a selling a call option. Before going any further, there are two kinds of options, one is a call option which gives the purchaser the option to sell the underlying asset at a given strike price. The other is a put option, which gives the purchaser the option to sell the underlying asset at a given strike price. Below is a picture of the payoff diagrams of a buyer and seller of a call option.

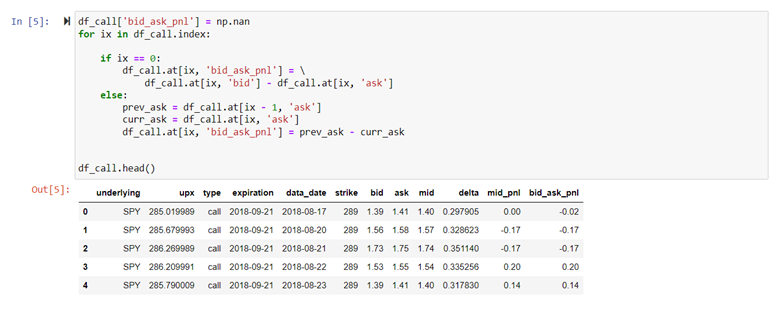
As stated above, in this example we are selling, or shorting the call option. To calculate the stock option PNL, a simple column titled bid_ask_pnl will be created. On the execution day (in this scenario 8/17/2018) the value is will be bid – ask, or -.02. For all the subsequent days, the value will be the current ask price subtracting the previous day’s ask price. The table below shows the bid_ask_pnl column on the far right.

The total PNL of the stock option is calculating by summing up the daily PNLs. This comes to a total of value of -1.65. It is important to note that value is also equal to the bid price on the execution day, 1.39, subtracting the option payoff. In this case the ending price was 292.04 with the strike being 289, meaning the option payoff was 3.04. So, 1.39 – 3.04 equates to the -1.65 we calculated from the daily PNLs. Remember, we are selling the call option, so it makes sense that when the option is “in-the-money”, the short position is losing money.